PARTNER CONTENT by JANUS HENDERSON
This content was paid for and produced by JANUS HENDERSON
Nick Watson, fund manager for the UK-based multi-asset team, provides his ‘match report’ for Janus Henderson’s Multi-Asset Core Income range in 2018. In this article, he looks at the divergent market forces that drove performance.
2018: a game of two halves
We entered 2018 with building concerns about markets. The irresistible influence of quantitative easing and a multi-year period of ‘Goldilocks’ economic conditions had pushed returns, markets, valuations and investor levels of bullishness to very elevated levels.
This translated into an outlook for lower returns and more volatility as markets came to terms with the fact that the tidal wave of quantitative easing was finite and due to end in December 2018, while politics and global trade also offered a potentially bumpy ride.
So how did 2018 actually play out? Well, to continue the already stretched sporting cliché, 2018 was very much a game of two halves.
First half: a choppy start but beta stars
January and February started off in volatile fashion as markets sharply corrected following a parabolic rally at the end of 2017 and a deluge of retail money chasing returns at its end. Positive inflation data in the US spooked bond and equity markets as investors feared a sharp acceleration in the pace of interest rate rises.
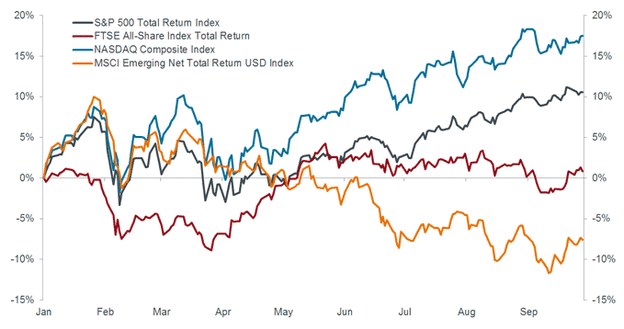
However, this fear of rising prices did not persist and markets swiftly resumed their steady march upwards. Nowhere demonstrated this better than the US equity market, which itself was led by an increasingly narrow and expensive sample of technology companies.
Markets resume their steady march upwards through Q3

Source: Bloomberg 28 09 2018
High-quality companies with steady earnings streams and a history of distributing profits to shareholders were completely ignored in favour of high growth startup companies. Income and diversification were sidelined, and while they delivered positive risk-adjusted returns, were ignored in favour of expensive and volatile ‘rocket fuel’ stocks.
So our expectation of lower returns and more volatility was hinted at by the market in January, but then fell by the wayside following the resurgence in US equity beta.
Second half: the market strikes back
Global equity markets peaked quickly in September, followed by a sharp reversal from all-time highs. An eruption in protectionist rhetoric from US President Trump spooked growth fears, while economic data broadly began to soften and the impact of pro-cyclical fiscal expansion in the US wore off.
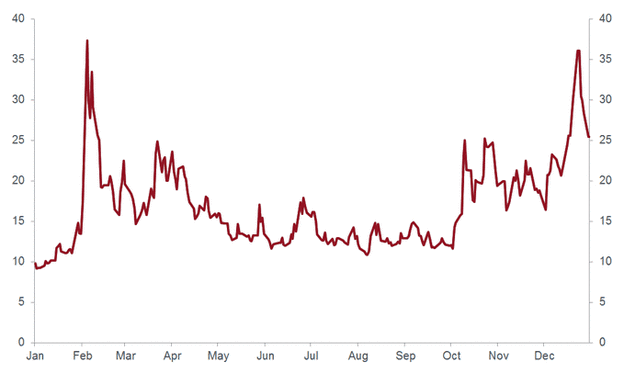
January volatility falls by the wayside: VIX Index 2018

Source: Bloomberg 01 01 2019
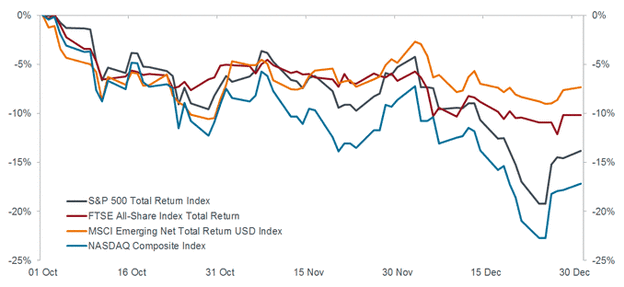
This market dynamic was the polar opposite of the first half of the year, as the market leaders reversed direction and gave back much of their gains before accelerating into negative territory amid the worst December for US equities since 1931.
Going into reverse: Q4 2018

Source: Bloomberg 31 12 2018
In this environment, high-quality income-paying companies offered some protection against these drawdowns, with some well-known companies, such as Unilever, delivering a positive absolute performance.
Corporate bonds sold off after a fabulous multi-year period of falling yields and tightening spreads. More defensive active strategies held up well while government bonds protected through this ‘risk off’ turbulence.
Diversification worked, in contrast to the first half of the year, when the benefits of improved risk-adjusted returns were ignored in favour of chasing beta. The natural blend of equities and fixed income dampened volatility and reduced drawdowns while alternative asset classes, such as infrastructure and property, delivered relatively good, uncorrelated returns and income streams as markets weakened around them.
For professional investors only. For promotional purposes.
These funds are designed to be bought by advised clients only. Potential investors must read the prospectus and key investor information document before investing. This website is for financial promotion purposes and is not investment advice.
These are the views of the author at the time of publication and may differ from the views of other individuals/teams at Janus Henderson Investors. Any securities, funds, sectors and indices mentioned within this article do not constitute or form part of any offer or solicitation to buy or sell them.
Past performance is not a guide to future performance. The value of an investment and the income from it can fall as well as rise and you may not get back the amount originally invested.
The information in this article does not qualify as an investment recommendation.
Issued by Janus Henderson Investors. Janus Henderson Investors is the name under which investment products and services are provided by Janus Capital International Limited (reg no. 3594615), Henderson Global Investors Limited (reg. no. 906355), Henderson Investment Funds Limited (reg. no. 2678531), AlphaGen Capital Limited (reg. no. 962757), Henderson Equity Partners Limited (reg. no.2606646), (each registered in England and Wales at 201 Bishopsgate, London EC2M 3AE and regulated by the Financial Conduct Authority) and Henderson Management S.A. (reg no. B22848 at 2 Rue de Bitbourg, L-1273, Luxembourg and regulated by the Commission de Surveillance du Secteur Financier).
Janus Henderson is a trademark of Janus Henderson Group plc or one of its subsidiaries. © Janus Henderson Group plc.
'This is a Janus Henderson Paid Post. The news and editorial staff of the Financial Times had no role in its preparation'
Find out more


