

PARTNER CONTENT by AMUNDI
This content was paid for and produced by AMUNDI

Earnings at risk: What climate change means for returns
Some investors are taking on more risk than they realise by assuming it’s ‘business as usual’ for heavy carbon emitters. In a new normal where emitting carbon incurs higher financial penalties, investors need to consider carbon pricing risk – the gap between the current carbon price and the price they might have to pay in the future in a 1.5-2°C world.
When we discuss climate with investors, we find there are often misgivings. Yes, we’re told, ESG and climate are important – but it’s hard to understand exactly how important, and harder still to integrate these concerns into a portfolio.
These misgivings often reveal a sense of dichotomy. On one hand, mounting evidence compels us all to make a climate impact with our portfolios; on the other, our fiduciary duty instructs us to act in the best financial interests of the principal.
Recently, we have been looking for a way to bridge the gap between financial risk and climate risk, and to help investors connect the dots between the climate imperative and the pursuit of the optimal risk-adjusted return.
In our view, integrating carbon pricing risk is a compelling way of doing just that.
Carbon pricing risk: an increasingly necessary metric
Let’s examine what we call ‘carbon pricing risk’. To be more specific, we’re referring to what might happen to a portfolio when we account for the carbon price in our risk analysis.
Carbon pricing is a network of global initiatives designed to curb emissions. In the first chart below, you can see that 23% of global emissions are now ‘covered’ by carbon pricing initiatives such as carbon taxes and emissions trading systems. The red bar shows EU allowances, and the big blue bar on the rightmost column is China.
This chart shows carbon pricing schemes are growing globally. The second chart shows how these schemes are spread around the world.
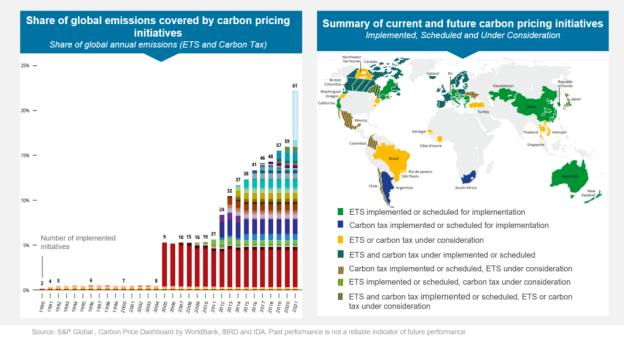
Source: S&P Global, as of December 2021.
Carbon pricing is proliferating, and even though it is still a nascent initiative and remains complex and fragmented, it will improve over time.
Unpriced carbon cost
When viewing the issue through a data scientist’s lens, a key metric to look at is unpriced carbon cost. This is the difference between what a company pays now in terms of carbon price and what it will pay in future. For this we use data from Trucost, part of S&P Global.
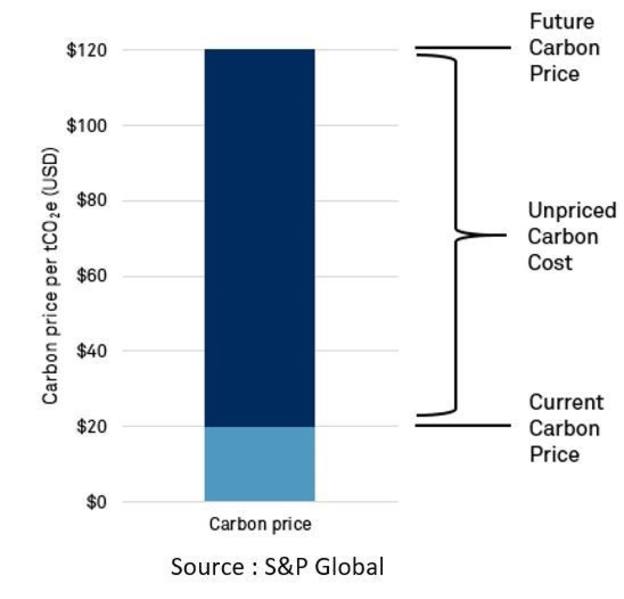
Trucost defines three carbon price scenarios in its methodology. In each of these forecasts, carbon prices rise dramatically over the coming years – meaning a growing gap between current and future price, and thus a greater unpriced carbon cost. Given carbon pricing schemes are one of the main tools in the policymaker’s kit, we are confident in our view that the carbon price will only continue to increase over time.
Projecting carbon price impact on earnings
We selected Trucost’s medium (“delayed action”) carbon price scenario for our analysis. Despite it being the middle path, we feel this could actually be a conservative assumption of where the carbon price could go.
To look at how unpriced carbon price risk could affect companies’ profitability, we started with the MSCI World index. Using earnings statements, we tried to represent the carbon price risk and what that would represent as a share of their EBITDA. This gave us a measure of “earnings at risk”, or more accurately, EBITDA at risk.*
Our analysis highlights a significant risk to future earnings from the unpriced expected future carbon price, especially in sectors such as energy, materials and utilities. In the utilities sector for example, the projected carbon price increases might wipe out 50% of the sector’s average EBITDA by 2040.
It’s important to note that 2040 is far in the future, and that these results depend heavily on modelling and on what changes are made to companies’ emissions and business models by then. So, we can’t safely say that this will happen. However, based on all the data we have access to, we can start to see carbon prices might pose a significant risk for these companies’ earnings.
Climate Transition & Paris-Aligned solutions
To continue the investigation, we looked at the alternative exposures to mainstream indices, using Paris-Aligned and Climate Transition benchmarks, or ‘PAB’ and ‘CTB’ respectively. These benchmarks, and the ETFs tracking them, aim to reduce the carbon emissions of a given exposure immediately – by 50% for PAB and 30% for CTB – and put a portfolio on a trajectory of reducing carbon emissions over time, typically by 7% per year.
So, we conducted the same exercises as before – same benchmark, same universe, same portfolio. As the carbon emissions are cut by 50%, we can very simply divide the earnings at risk by a factor of two (see Earnings at Risk chart below).

We conducted the same exercise for enterprise value at risk, meaning the projected reduction in enterprise value in a portfolio (see chart below). This starts from Europe in light blue, to Climate Transition in turquoise blue, to Paris-Aligned in green. We can see here a quite mechanical reduction in risk when investing in CTB or PAB benchmarks, and one that is quite consistent across regions.

Scope 1, Scope 2 and Scope 3 upstream (supply chain effect) emissions are included, while Scope 3 downstream & upstream (change in demand due to rising costs) emissions are excluded in this analysis.
Source: S&P Global, Lyxor International Asset Management. Relevant Benchmark is the relevant MSCI standard index of the region, Climate Change / CTB index is the available Climate Transition Benchmark by MSCI and PAB Index is the corresponding Paris Aligned Benchmark published by S&P on the relevant region. Data as at 11/10/2021. Past performance and/or forecasts are not a reliable indicator of future performance.
So, if you’re looking at a Europe, US or World portfolio, and want to reduce carbon emissions, that reduction could come with a commensurate reduction in financial risk. From an investment perspective, therefore, this might actually make your choice more fiduciary.
Since carbon pricing is here to stay, and the price is very likely to increase in future, it poses a huge and underappreciated risk for companies, especially in the energy, materials, and utilities sectors. Climate indices such as the Paris-Aligned Benchmark (PAB) significantly reduce carbon emissions, and in doing so, could significantly reduce the carbon pricing risk embedded in holdings like this in your portfolios today.
Learn more about our Climate ETFs
*EBITDA refers to earnings before interest, taxes, depreciation and amortisation and is a common metric for evaluating a company’s operating performance.
CAPITAL AT RISK. PLEASE READ THE IMPORTANT INFORMATION BELOW.
For Professional Clients only. This promotion is being issued in the United Kingdom (the “UK”) by Amundi (UK) Limited, 77 Coleman Street London EC2R 5BJ, UK. Amundi (UK) Limited is authorised and regulated by the Financial Conduct Authority (“FCA”) and entered on the FCA’s Financial Services Register under number 114503. This may be checked at https://register.fca.org.uk/ and further information of its authorisation is available on request.
This promotion is only directed at persons who are Professional Clients (as defined in the FCA’s Handbook of Rules and Guidance), is not intended for citizens or residents of the United States of America or to any “U.S. Person” (as this term is defined in SEC Regulation S under the U.S. Securities Act of 1933) and must not be distributed to the public, nor relied on or acted upon by any other persons for any purposes whatsoever.
This promotion is for information purposes only and does not constitute a recommendation to buy or sell from neither Amundi Asset Management nor Lyxor International Asset Management (“Lyxor”) or Lyxor Asset Management UK LLP (together, “Amundi”). Amundi ETF designates the ETF business of Amundi and includes funds under both Amundi ETF and Lyxor ETF denominations (the “Fund(s)”). Past performance is not a guarantee or indication of future results. The Funds that are referred to in this promotion are recognised collective investment schemes for the purposes of Section 264 of the Financial Services and Markets Act 2000. Indices and the related trademarks used in this document are the intellectual property of index sponsors and/or its licensors. The indices are neither sponsored, approved or sold by Amundi.
Amundi does not accept any liability, responsibility or duty of care, whatsoever, with respect to this document. Amundi does not give any guarantee (whether express or implied), warranty, undertaking or representation as to the accuracy, validity, relevance, exhaustiveness, timeliness, completeness and/or reliability of the information contained herein. The opinions expressed reflect the current judgement of the personnel of Amundi and may be subject to change without notice.
Investment in a Fund must only be made based on the key investor information document and its prospectus, which include information on the investment risks, and are available in English on amundietf.com or lyxoretf.com. Transaction costs may occur when trading ETFs. Potential investors in the UK should be aware that none of the protections afforded by the UK regulatory system will apply to an investment in a Fund and that compensation will not be available under the UK Financial Services Compensation Scheme.
This promotion was not reviewed, stamped or approved by any financial authority. Reproduction prohibited without the prior written consent of Amundi.
Find out more


