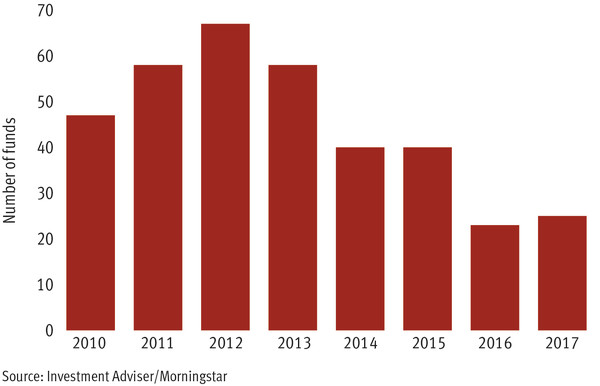
The number of ‘red flag’ funds identified by Investment Adviser as at risk of being closed or merged has seen a slight increase this year to 25, up from 23 in 2016 – the first increase since 2012.
Of the 25 funds in this year’s list – using data from Morningstar based on the metric explained on the following page – seven have appeared in the list for three consecutive years, while five have made an appearance for five consecutive years.
Commenting on the list, Darius McDermott, managing director at FundCalibre, says some of the funds have appeared in the firm’s own RedZone research, adding: “The long-term underperformance and lack of assets only points to one thing – they should all be put to bed.”
Since last year’s list, two of the funds flagged then have closed while three were merged with other funds due to their small size. Ten funds reappear from 2016, although some have been revamped.
The Neptune Global Smaller Companies fund makes its third appearance in the list. Formerly known as the Neptune Global Special Situations fund, it changed its name and objective in July 2016, a move that might see it disappear from the list in the future should performance improve.
The Barings Emerging Markets fund marks its second appearance, although assets have increased from 2016. The firm notes it continually reviews its investment capabilities, and points out that “Barings’ flagship EM investment strategies include multiple top-quartile performers”.
Several funds have been renamed, with the ConBrio UK Smaller Companies fund, a long-term member of the list, now the Castlefield UK Smaller Companies fund. The team has overhauled the investment process, too.
Manager Alistair Currie says: “The introduction of this enhanced investment process appears to have had a positive effect as fund has outperformed the sector average in both 2015 and 2016. Unfortunately the disappointing performance in 2012, 2013 and 2014 continues to affect the five-year figures.”
The VT Munro Smart Beta UK fund has been renamed from the VT Smart Dividend UK portfolio, coinciding with a refining of objectives as the fund seeks to replicate the performance of the Freedom Smart-Beta UK Dividend Index.
Robert Davies, lead manager for the fund, says it suffered due to quantitative easing, which devalued cash and revalued riskier assets. While small and mid caps fared well, the fund has a large exposure to large caps. He adds: “We have a process and value was out of favour for most of the last nine years, but last year was a great year for value which benefited us.”
This year’s list also sees some funds returning after a brief absence, including the S&W Deucalion fund and the Jupiter Global Ecology Growth Sicav.
A spokesperson for Smith and Williamson’s Fund Administration – the fund’s administrator, but not its investment manager – says: “This is a closely held fund, which operates in accordance with a specific mandate appropriate to its investors and, as such, would not look to outperform a benchmark.”
Jupiter points out environmental investing “is a relatively niche area” and this is a specialist fund within the firm’s broader £883m environmental and sustainability strategy. The Marlborough Emerging Markets fund has also reappeared, although the firm notes a new investment team took over just over four years ago and performance has improved.
Among entrants to the list is the SLI Short Term Money Market fund, which the firm says is not actively marketed and is generally used by investors in other funds as “a very short-term holding entity”. It adds: “We regularly review funds and our internal governance processes recently instigated an assessment of this offering.”
Margetts Opes Income is another entrant, although Wayne Buttery, fund manager at Margetts Fund Management, points out the Flexible Investment sector “houses very diverse funds with totally different investment objectives”, and adds the fund “easily meets the investment criteria stated in the fund objectives.”
The MFM UK Opportunities fund makes it onto the list despite its one and three-year performance being top quartile in its peer group. Oliver Brown took over as lead manager in 2013 and notes the fund is “unique in many ways”, underpinned by an “individual investment process”. The fund is currently profitable.
The Old Mutual Global Bond also makes it first appearance, although Warren Tonkinson, managing director at Old Mutual Global Investors, notes in 2016 the firm appointed Mark Nash and Nicholas Wall to enhance the fixed income capability, adding: “As they start to gather momentum we would expect this global fixed income fund to see better performance and attract more assets.”
Nyree Stewart
2017 Red Flag Funds: Expert view
Adrian Lowcock, Architas investment director, says:
“Looking at this list there are a lot of boutique fund groups, which might go some way to explaining why they haven’t been soft closed. It will undoubtedly be harder for a boutique to close a fund as they don’t necessarily have larger strategy to support the business. At the same time there is a mix of funds from larger groups, but these are mainly in areas for which the group is not as well known and probably therefore doesn’t have the expertise to compete with the more established and better-performing funds.
“The industry – and indeed investors – needs new fund launches to create opportunities and bring in new managers, but there needs to be better discipline on closing unsuccessful products. Closing a fund is often the right thing to do for investors as well as for the company. But it isn’t a straightforward blanket approach; some strategies take time to come to fruition, while others may always be niche products. Ultimately, a style or asset class might just be out of favour and investors need to wait. The issue is funds under £10m tend to be expensive to run as there are plenty of fixed costs. Investors need to look out for themselves and review if they have any of these holdings and consider cheaper alternatives.”
Red flag funds 2017
| Fund | Launch date | Size (£m) | IA sector | Kiid OCF | 1-year return | 3-year return | 5-year return |
| Baring Emerging Markets | 20/11/98 | 7.1 | Global Emerging Markets | 1.9 | 35.9 | 48.7 | 37.2 |
| Castlefield UK Smaller Companies | 01/06/07 | 5.5 | UK Smaller Companies | 2.8 | 22.8 | 26 | 84 |
| CF Purisima EAFE Total Return | 22/02/07 | 5.3 | Flexible Investment | 2.1 | 29.3 | 33.4 | 58.2 |
| CF Purisima UK Total Return | 01/03/07 | 8.2 | UK All Companies | 1.6 | 20.7 | 18.3 | 43.6 |
| FP New Horizon Growth | 06/09/05 | 6.8 | Mixed Investment 40-85% Shares | 1.25* | 16.9 | 28.7 | 46.6 |
| GAM MP UK Equity Unit Trust | 18/05/99 | 9.5 | UK All Companies | 2 | 16.1 | 15 | 52.1 |
| GS Global Equity Partners ESG | 16/09/08 | 2.9 | Global | 1 | 27.9 | 39.3 | 74.4 |
| GS Strategic Global Equity | 04/12/92 | 7.6 | Global | 1.1 | 29.5 | 42.2 | 52.7 |
| Jupiter Global Ecology Growth | 17/08/01 | 9.3 | Global | 0.7 | 25.8 | 36.7 | 77.2 |
| Legg Mason ClearBridge Growth | 25/02/04 | 3.8 | North America | 1.7 | 32.3 | 62.5 | 97.1 |
| Legg Mason IF QS Emerging Markets Equity | 16/02/04 | 3.4 | Global Emerging Markets | 1.9 | 20.9 | 27.4 | 35 |
| Margetts Opes Income | 14/01/03 | 7.6 | Flexible Investment | 1.8 | 14.9 | 25.4 | 52.6 |
| Marlborough Emerging Markets Trust | 08/06/04 | 7.8 | Global Emerging Markets | 1.5 | 38.3 | 46 | 35.6 |
| MFM UK Primary Opportunities | 05/01/96 | 9.5 | UK All Companies | 0.9 | 25.5 | 32.7 | 61.4 |
| MFS Meridian Continental European Equity | 27/02/06 | 7.1 | Europe ex UK | 1 | 22.4 | 21.1 | 68.6 |
| MFS Meridian Japan Equity | 31/07/07 | 7.6 | Japan | 2.1 | 25.8 | 54.7 | 73.5 |
| Neptune Global Smaller Companies | 31/12/07 | 2.7 | Global | 1.2 | 24.9 | 32 | 36.9 |
| Old Mutual Global Bond | 13/09/00 | 7.1 | Global Bonds | 1.4 | 7.8 | 20.5 | 13.1 |
| Principal Asian Equity | 06/11/92 | 5.1 | Asia Pacific ex Japan | 1.5 | 38.9 | 49.6 | 56.7 |
| Principal EM Equity | 19/02/98 | 5.3 | Global Emerging Markets | 1.9 | 35 | 36.5 | 24.7 |
| Principal Global Equity | 04/12/92 | 7.2 | Global | 2 | 22.5 | 46 | 81.4 |
| SF Delmore Growth & Income | 04/11/02 | 2.5 | UK All Companies | 2.7 | 13.7 | 13.9 | 46.6 |
| SLI Short Term Money Market | 15/09/04 | 7 | Short Term Money Market | 0.5 | 0.1 | 0.2 | 0.2 |
| Smith & Williamson Deucalion | 02/04/03 | 7.6 | Flexible Investment | 6.3 | 13.2 | 42.6 | |
| VT Munro Smart Beta UK | 18/09/07 | 6.6 | UK All Companies | 1.9 | 18.2 | 13.2 | 41.3 |
*AMC for B share class as of November 30 2016. Cumulative performance to April 30 2017. Rebased in pounds sterling and ranked within table. Source: Morningstar
Red flag funds methodology
Investment Adviser sought to identify ‘red flag’ funds – those vehicles that could face imminent pressure to be closed or merged with a sister fund – across the Investment Association sectors using data from FE Analytics and the following metric:
• The fund must have been launched in 2008 or earlier (and therefore have been through a full business cycle).
• It must currently have less than £10m in assets under management.
• It must have ranked in the third or fourth quartile of its peer group in terms of its performance in a five-year period.
Red flag funds in numbers
2 – Number of funds that closed from the 2016 list
7 – Number of red flag funds that appear for three consecutive years
4 – Number of funds in the IA Global Emerging Markets sector
5 – Number of funds in the IA UK All Companies and IA Global sectors
25 – Number of red flag funds this year
124 – The number of funds launched in 2016
Launches and closures: UK-domiciled funds from 2012 to 2016
| Number of funds | |||||
| 2012 | 2013 | 2014 | 2015 | 2016 | |
| Launched | 237 | 203 | 229 | 205 | 124 |
| Closed | 110 | 153 | 106 | 110 | 100 |
| Total | 127 | 50 | 123 | 95 | 24 |
Source: Investment Association
Red flag funds appearing three consecutive years
| Fund | Launch date | Size (£m) | Kiid OCF | 1-year return | 3-year return | 5-year return |
| Legg Mason ClearBridge Growth | 25/02/04 | 3.8 | 1.7 | 32.3 | 62.6 | 97 |
| Neptune Global Smaller Companies | 31/12/07 | 2.7 | 1.2 | 24.9 | 32 | 36.9 |
Notes: Total return custom table from UK Investment Association universe. Rebased in pounds sterling and ranked within table.Source: Investment Adviser/Morningstar/FE Analytics
Red flag funds appearing five consecutive years
| Fund | Launch date | Size (£m) | Kiid OCF | 1-year return | 3-year return | 5-year return |
| Castlefield UK Smaller Companies | 01/06/07 | 5.5 | 2.8 | 22.8 | 26.1 | 84 |
| FP New Horizon Growth | 06/09/05 | 6.8 | 1.3* | 16.9 | 28.7 | 46.6 |
| MFS Meridian Japan Equity | 31/07/07 | 7.6 | 2.1 | 25.8 | 54.7 | 73.5 |
| SF Delmore Growth & Income | 04/11/02 | 2.5 | 2.7 | 13.7 | 13.9 | 46.6 |
| VT Munro Smart Beta UK | 18/09/07 | 6.6 | 1.9 | 18.2 | 13.2 | 41.3 |
Notes: Total return custom table from UK Investment Association universe. Rebased in pounds sterling and ranked within table. *AMC for B share class as of November 30 2016. Source: Investment Adviser/Morningstar/FE Analytics |