The US equity volatility index VIX topped 80 back in March, signalling a crisis of confidence akin to that in the Global Financial Crisis.
It subsequently settled below 50, a level not touched since 2008.
As investors seek to balance the difficulty of the current situation and potentially position their portfolios for a recovery, they might wonder - are these elevated levels in the VIX an indication that markets are too volatile to invest?
The VIX Index is designed to be a measure of expected volatility for the US stock market, derived from real-time prices of S&P 500 Index options.
Although it is built for the US equity market, it is the most widely-used bellwether for global investor confidence and indicator of current global equity market volatility.
Daily VIX data goes back to January 1990, and prior to the coronavirus pandemic, there had only been three periods in history when the VIX had passed 50; all were around the Global Financial Crisis in 2008 and 2009.
For each period of VIX above 50 we looked at the subsequent 12 month returns on the S&P 500 Index of large US equities.
We chose the S&P 500 because the VIX is calculated using S&P 500 options, and it represents the largest component of global equity markets at about 65 per cent of global developed large cap equity market cap.
Table: Historical Subsequent 12 Month S&P 500 Returns after Elevated VIX readings
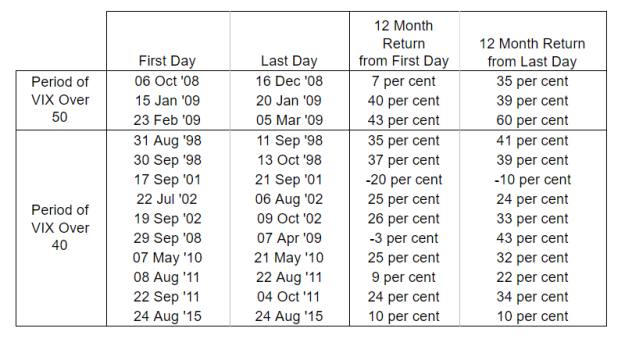
Source: Goldman Sachs Asset Management, Bloomberg
You can see that returns were spectacular over the following 12-month periods, particularly if you waited to invest until as soon as the VIX dropped back below the 50 mark.
Although the data is limited to those three time periods, it does suggest that returns can be attractive over 12 months, even if they are muted in the shorter term.
The average subsequent returns from every single day with a VIX reading over 50 (65 days in total) is 0.6 per cent over 1 month, 0.9 per cent over 3 months, 0.1 per cent over six months, an 32.4 per cent over 12 months.
The 12-month return of 32.4 per cent is astoundingly high, especially compared with the S&P 500 long-run average annual return of 5.5 per cent (Q4 1927 – Q1 2020).
Historical context
Of course, this is a somewhat limited data set, but it does suggest that if you have a timeframe of at least a year, now may be a good time to invest spare cash.
50 is quite an extreme reading on the VIX, demonstrated by the fact that 30 years of data only produced limited observations.
However, there have been more periods when the VIX has been over 40.
Although less extreme, readings of 40 have still been confined to periods of real stress in equity markets and the story there is largely the same: patience is generally rewarded.
We have 10 separate instances of breaking the 40 barrier over the course of the past three decades.
In all but two of those periods (9/11 and the Global Financial Crisis), equity returns were positive 12 months from the beginning of the breach, and all but one of the periods (9/11) saw positive returns 12 months after the end of the breach.
The average subsequent returns from every single day with a VIX reading over 40 (184 days in total) tell a similar story to the over-50 data we presented earlier, with 2.0 per cent over 1 month, 3.3 per cent over 3 months, 2.4 per cent over six months, and 34.0 per cent over 12 months.
These statistics are particularly relevant now because the VIX has now dropped back below both the 50 and 40 barriers.
Of course, it is important to assess the potential risks that threaten to derail the long-standing historical relationship between VIX levels and equity returns.
Outlook
Today, Covid-19 cases are still increasing globally, fuelled by increases in the US and a few EM countries, Brazil and India in particular.
This increase could lead to longer lockdowns and further significant human and economic costs.
A second wave, or indeed multiple waves, of infections could disrupt the recovery across the global economy and asset prices, leading to a prolonged bear market of more than a year.
In such scenarios, the time to significantly positive equity returns could be considerably longer than the 12-month rule that has so often held.
The news-flow around the decreasing number of new cases in many countries, increased testing availability, and potential new treatments gave reasons for hope and a backing for market’s recent moves higher.
Further, substantial global central bank liquidity supports risk asset prices.
For long-term investors with investment horizons of at least a year and the ability to withstand extreme market swings within that period, past experiences suggest that now may be an opportune time to redeploy capital into the market.
Julia Rees is head of portfolio strategy, EMEA and Asia, at Goldman Sachs Asset Management