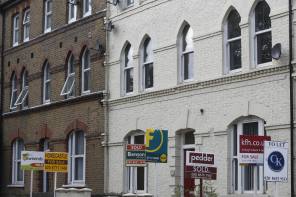

The Gloucestershire town of Cheltenham saw the highest percentage rise in house prices in 2017, according to research by Halifax.
The average house price in the town that is located on the edge of the Cotswolds was 13 per cent more than in the previous year, increasing from £277,118 in 2016 to £313,150 in 2017.
According to the research, this is nearly five times the 2.7 per cent increase registered during the 11 months ending November 2017 for the UK as a whole.
This is less than the price growth registered in 2016, of 6.5 per cent.
The seaside town of Bournemouth on the south coast experienced the second biggest rise, with an increase of 11.7 per cent, while Brighton, on the south east coast, completed the top three with an 11.4 per cent growth in the past year.
Fifteen of the 20 top house price performer towns are located in London and southern England – these include Crawley, Newham, Peterborough, Gloucester and Exeter.
Huddersfield in Yorkshire and the Humber, Nottingham and Lincoln in the East Midlands, along with Stockport in the North West and Swansea in Wales are the top performers outside London and the south, completing this year’s top 20.
Town/Area | Region | Average House Price £ (2016) | Average House Price £ (2017) | Change £ | Change % |
Cheltenham | South West | 277,118 | 313,150 | 36,033 | 13.00% |
Bournemouth | South West | 245,099 | 273,687 | 28,587 | 11.70% |
Brighton | South East | 336,374 | 374,662 | 38,289 | 11.40% |
Crawley | South East | 293,105 | 323,660 | 30,555 | 10.40% |
Newham | Greater London | 365,438 | 402,781 | 37,344 | 10.20% |
Peterborough | East Anglia | 200,309 | 220,623 | 20,314 | 10.10% |
Gloucester | South West | 211,429 | 231,581 | 20,152 | 9.50% |
Huddersfield | Yorkshire and the Humber | 171,007 | 186,988 | 15,981 | 9.30% |
Exeter | South West | 251,085 | 273,874 | 22,789 | 9.10% |
Nottingham | East Midlands | 177,513 | 193,397 | 15,884 | 8.90% |
Gravesend | South East | 287,544 | 312,940 | 25,396 | 8.80% |
Lincoln | East Midlands | 179,669 | 194,723 | 15,053 | 8.40% |
Stockport | North West | 217,410 | 235,147 | 17,736 | 8.20% |
Swindon | South West | 214,633 | 231,316 | 16,683 | 7.80% |
Redbridge | Greater London | 441,167 | 475,148 | 33,981 | 7.70% |
Swansea | Wales | 153,121 | 164,895 | 11,774 | 7.70% |
Barnet | Greater London | 542,353 | 584,049 | 41,697 | 7.70% |
Richmond Upon Thames | Greater London | 600,648 | 646,112 | 45,463 | 7.60% |
Portsmouth | South East | 207,196 | 222,704 | 15,508 | 7.50% |
Grays | South East | 270,277 | 290,422 | 20,145 | 7.50% |
United Kingdom |
| 247,933 | 254,609 | 6,677 | 2.70% |
According to Russell Galley, managing director at Halifax, “all of the top 20 performers recording growth of at least double the national average”.
He said: “Unlike last year, the top performers are not exclusive to London and the south east, with the top spot now belonging to Cheltenham in the south west, and towns in East Anglia, East Midlands, North West, Wales and Yorkshire and the Humber also making the list.”
On the other hand, thirteen towns recorded declines in house prices in 2017, with the largest fall in Perth from £190,813 in 2016 to £180,687 in 2017, or -5.3 per cent.
Mr Galley said: “The majority of towns in which house prices have dropped in the last year, are situated within Scotland or Yorkshire and the Humber.
“Generally speaking, property prices in these areas have been constrained by lower employment levels or relatively weaker economic conditions when compared to those areas that have seen house price growth.”
maria.espadinha@ft.com


